This follows the pattern from the first quarter. Thus, over the first half of 2014, equities have underperformed by bonds by a massive 560bp. Utilities have outperformed SPX by nearly 3 times. Cyclicals have lagged.

SPX rose 4% during 2Q14. Among US indices, it was the star performer together with NDX. The small caps index (RUT) was the dog, losing 0.7%. But the best performing equity market was emerging markets. This is notable since investors entered the quarter 31% underweight emerging markets. The worst performing equity market in 2Q was Europe; this is also notable, as it has been the consensus long for fund managers for 10 months in a row.

Expectations for the second half of 2014 are very high. Fund managers surveyed by BAML are 48% overweight equities, their highest equity allocation since January. Funds are overweight European shares by the second highest amount since June 2007. The only higher weighting in the past 7 years was in October 2013, after which European shares traded sideways for the next 5 months (chart from BAML; read further here).

In the US, advisors' expectations are equally optimistic, with 3.7 times more bulls than bears. This is an extreme. In the past, such bullish extremes have been followed by relatively weak equity performance (chart from Schaeffers).

Investor expectations are also embedded in put/call ratios. The equity put/call ratio (smoothed using a 10-ma) is now at the lowest in 3-1/2 years. Under similar circumstances in the past 10 years, equity markets have struggled to sustain much upward progress. Low ratios in 2010 and 2011 preceded large negative returns. This is clearly not what investors are positioned to expect in the coming months.

The irony is that, despite the outperformance of bonds over equities in 2014, bonds remain a hated asset class. Fund managers' bond allocations are now at a 6 month low. Remarkably, 88% of fund managers believe US 10-year yields will be above 2.5% by year-end. Yields were 2.46% on May 30. In other words, essentially every fund manager believes that May marked the low in yields. In the past, when expectations have been this high (green circles), rates have typically not risen (yellow shading; chart from BAML).

Driving the dynamic between bonds and equities are investor expectations that demand is on the threshold of rapid acceleration. That expectation so far lacks much empirical support.
For example, "real final sales" (GDP less changes in inventories) grew at just 1.5% in 1Q 2014. The meme is that severe winter weather distorted demand. That may be, but since 1Q 2013, year-over-year growth each quarter has been 1.7%, 1.7%, 1.7%, 1.8% and 1.5%. For all the chatter about the first quarter being an outlier, demand growth was very consistent with prior quarters over the past year. If there is an upcoming acceleration, it's not yet visible in the data.

You get the same view if you look only at sales growth among SPX companies. In the past two years, sales have grown at just 2.3% (nominal) per annum. The consensus on Wall Street is that this will improve slightly to 3% for the full-year 2014. The macro data and the corporate reporting data are consistent.
Looking ahead, "summer" months are noted for being mostly weak, but July is usually the exception. In other words, a seasonal fall in May and/or June (like in 2013) is often retraced in July.

That pattern obviously doesn't fit this year: SPX has been up every month since January, five months in a row. Does this matter?
Normally, yes. Since 1988, July has been positive 13 times. In 9 of those years, May and/or June was down; in another year, stocks fell 10% in April. So, 77% of the time that July is up has been after a fall in the prior months.
That leaves just 3 years when July was up after May and June were also up: 1995, 2003 and 2009.
- 2003 and 2009 marked the end of multi-year bear markets.
- 1995 was the wonder year during which stocks rose 18 of 19 months. It also followed a year (1994) when stocks rose a paltry 0.7%.
Moreover, focusing on just the past 10 years, SPX has made a notable low (arrows) between May and July (shading) every year. In each case, SPX retraced at least to its Bollinger mid-band (currently 1880); in 8 of 10 years, it has retraced to the lower Bollinger band (currently 1800). Unless 2014 is an exception, this implies downside of 3.5% to 7.5%.

As always, however, we remain fully cognizant that the current market has shredded prior precedents.
Expectations coming into the week that ended were for weakness. The week after June options expiration has been down 10 out of the past 11 years (post). Moreover, the total put/call ratio hit an extreme low last Friday: in the past, SPX has subsequently lost an average of 0.7% within the next 5 days (post). In the event, SPX had declined by 1% at Thursday's low and ended the week modestly lower.
The upcoming week should be quiet. It's a short week: markets close at 1p EST on Thursday and remain closed on Friday.
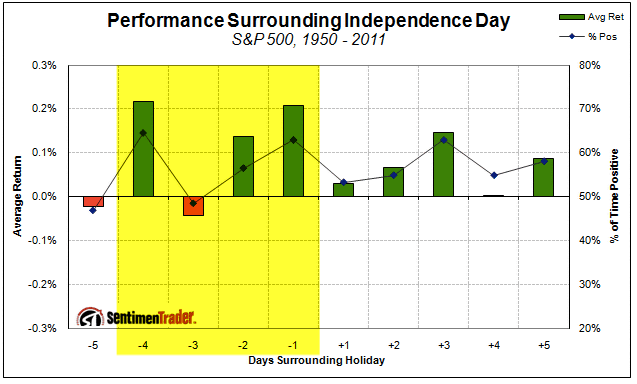
If anything, there should be an upward bias to trading: June ends strong and July starts strong (chart from SentimenTrader).
Moreover, NFP is released on Thursday. SPX has been up on the day of NFP in 17 of the last 19 months.
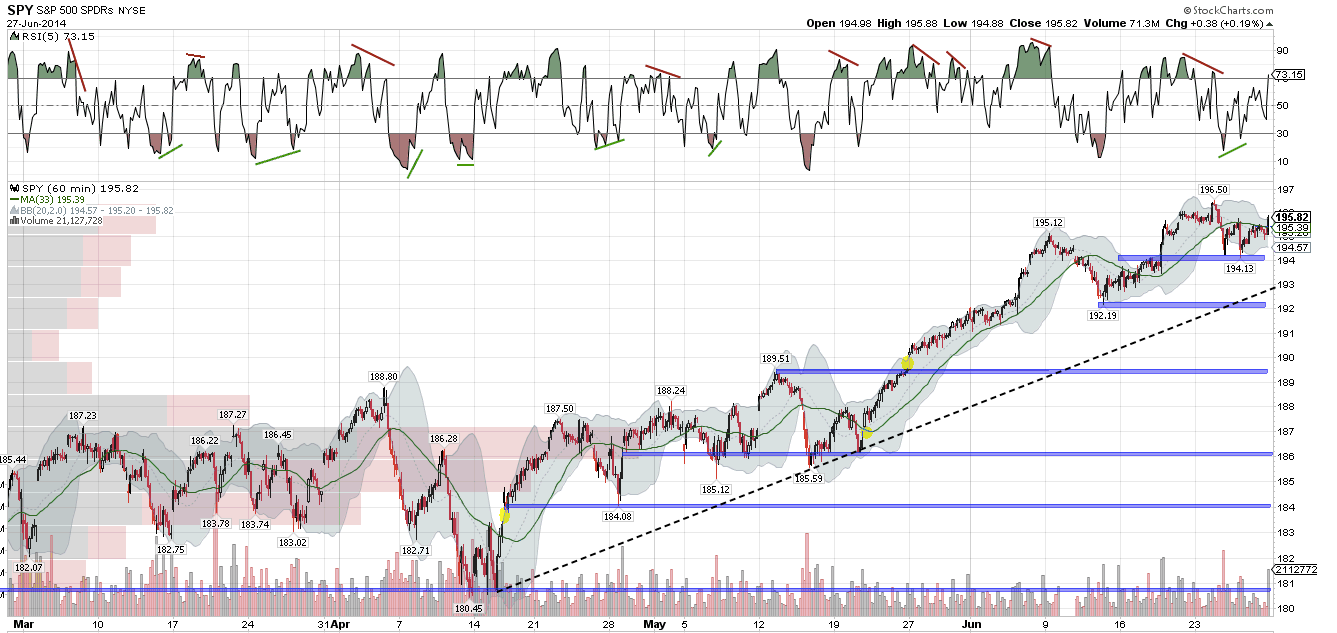
On the daily timeframe, SPY is above all of its moving averages. All of these moving averages are trending higher. RSI is not overbought but should SPY close above 196, there will be a negative divergence. This suggests that upward momentum is waning - a watch out.
Key short term support is near 194 (now also the home of the 20-dma); that area was tested twice in the past week and should SPY return a third time the odds will favor a break lower. A break lower targets 193 (weekly S2 and the April low trend line) and then 192 (the mid-June low). On the upside, weekly R1 is 196.8.
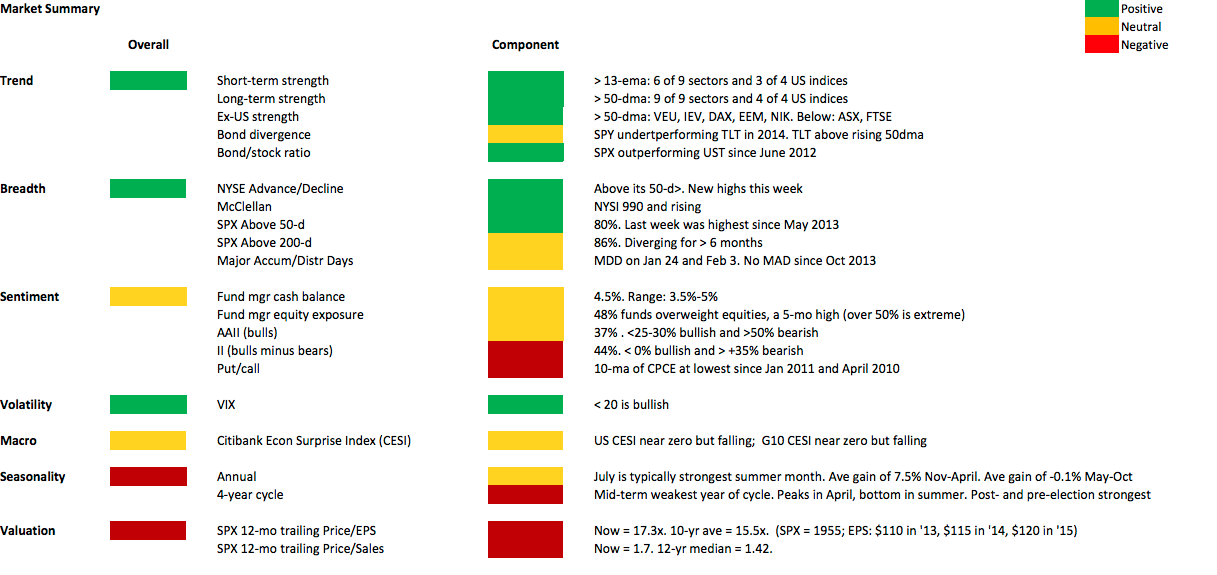
Our weekly summary table follows.